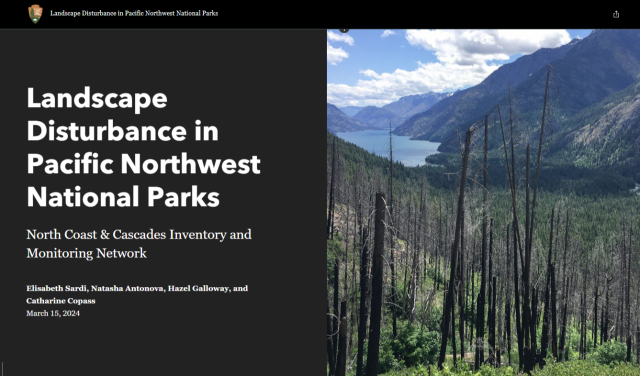
Check out this StoryMap shared to us from ETS community member Hazel Galloway and her colleagues Elisabeth Sardi, Natasha Antonova, and Catharine Copass, highlighting how NASA satellite data can complement data from the parks to create better storytelling!
The National Park Service’s inventory and monitoring program keeps track of “ecological vital signs”—sensitive indicators of environmental health tracked over years or decades.
In the North Coast & Cascades Network (NCCN), which is composed of eight parks across western Washington and Oregon, most of these vital signs are monitored in the field. Scientists sample water quality, measure glaciers, survey tidepool communities, and monitor subalpine meadows. This data helps the parks tell stories about the impacts climate change is having in real time—but also reveals some systems that are showing a surprising resilience to climate stresses.
Capturing Landscape Change with Landsat Data

One NCCN vital sign, however, is not measured on the ground. Landscape Change—a program that tracks fires, floods, landslides, avalanches, forest pests, windstorms, and other disturbances—is monitored from 438 miles above the Earth’s surface by the Landsat satellite!
Managed by NASA and US. Geological survey, the Landsat program has been capturing images of the Earth’s surface since the 1970’s to assist land managers, planners and policymakers in making more informed decisions about natural resources and the environment.
There are currently two Landsat satellites operating, both collecting data from different color bands of the electromagnetic spectrum. Since different surfaces reflect various types of light, Landsat allows us to observe different phenomena on Earth’s surface and track those changes over time.
Each year, Landsat images of four NCCN parks are analyzed by a program called Landsat-based Detection of Trends in Disturbance and Recovery (LandTrendr). LandTrendr detects areas larger than two acres that have changed compared to the previous year.
Sharing Climate Stories with StoryMaps
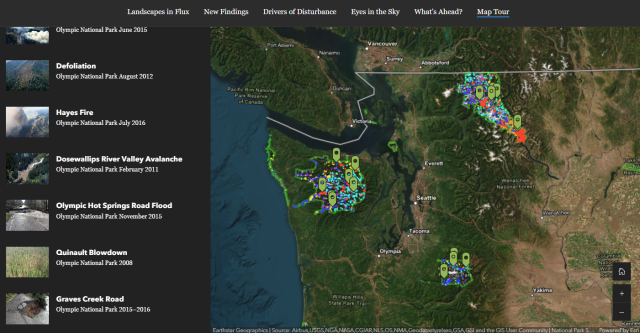
Hazel shared with us: Just last year, we finished an analysis of trends in disturbances in Mount Rainier, North Cascades, and Olympic National Parks between 1987 and 2017 and wanted to share these results—and the climate stories they told. We decided to build an ESRI StoryMap, a format that allowed us to draw on GIS data and map specific disturbance events as we told the larger story of trends. To make the analysis more engaging, the StoryMap also included charts, animated timelapse GIFs, timelines, videos, comparison sliders, and many photos of individual disturbance events.
 Close to the beginning of the piece, we asked the question: What causes landscape disturbance? Using an Earth Systems Science framework, we gave examples of cycles and trends at the global, regional, and local scales that might bring about the extreme conditions and weather that often cause landscape disturbances like fires or floods. It was important to communicate that all the studied disturbances are natural—however, when trends in frequency or size appear over time, systems at multiple levels are likely involved.
We also tried to take readers behind the scenes and illustrate how Landsat data—especially bands outside the visible spectrum—can be used to “see” landscape change in a way that the naked eye cannot. We hoped this would help shine some light into the black box of where these results came from.
Finally, we tried to place climate-related disturbance trends within the broader regional and national context of climate impacts—and responses. We wanted to leave readers on a note that was serious but hopeful:
“Recent studies have shown that ecosystems of Pacific Northwest national parks may still be showing resilience to the stresses of rising temperatures. However, continued warming may exceed the stress tolerances of systems that rely on mountain snowpack, infrequent fires, and cold rivers and oceans. As these systems shift, the North Coast and Cascades Network will continue to monitor changes at the landscape scale.
“Climate change, though serious, is ultimately solvable. Explore positive actions that can—and have—led to big changes, told in stories throughout the national park system.”
So far, the StoryMap has received about 1,700 views, but we do not have specific metrics on who the story is reaching. However, it was sent out by email to all employees at the eight NCCN parks. We have also shared portions at seasonal trainings to introduce interpretation staff to the climate stories we can tell using data from space! We will continue to use it as an outreach product to illustrate concrete changes we have observed in the Pacific Northwest—and take readers behind the scenes into how we know what we know.
For more details, contact:

Hazel Galloway
Science Communication Specialist
North Coast & Cascades Network
National Park Service
Direct: 360.565.2979
email: This email address is being protected from spambots. You need JavaScript enabled to view it.